Time Tracker
Introduction
A few days ago I was reading a book about issues in the workplace. One of the problems hightlighted was interruptions during flow (a state in which you kind of isolate from the external environment and focus solely on your task at hand).
Being able to quantify the amount of distractions you get in your work may help you and the others around you to improve the whole environment and be more productive. Being in the flow is the best way to increase your productiveness, but not only do interruptions distract you from the task at hand (taking away useful time to work), they also require you to spend even more time after each one of them to get back into “flow mode”. Since such interruptions may be hard to track and report, I started thinking of a way to better identify them and keep a trace of each.
Developing Time Tracker
In approaching the problem I identified two main points that my solution should adhere to:
- Easily track start and end times of an interruption, as well as a reason for it.
- Easily activate it without being a distraction by itself.
Since I spend my work time in front of a computer screen, the way I decided to go, then, was to develop an application that I could start with a globally bound shortcut. Such an application should record start time when activated, and then patiently wait for my input (and potential notes) to record end time and close.
Here is what I came up with:
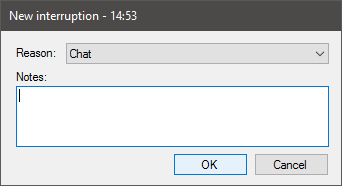
At the start of my work session I run my application, which unobtrusively remains in the tray icon area. Whenever an interruption occurs I press Win + Alt + I, and the application interface pops up, registering the start time, as can be seen in the title bar. At this point I can normally use my workstation, if needed, or I can even lock it if I have to temporarily leave. When I return to my work I select the reason of the interruption, add a few notes if needed and press ok. The total interruption time is then recorded into a csv file that can be easily handled with any scripting language (see below).
Recurring distractions even more easily, since the application remembers the last reason and proposes it when it pops up.
Usage
As I said, use is pretty straightforward: run the application (which remains in the tray icon area) and press Alt + Win + I to pop up a new interruption window. When done, fill the form (in its most basic usage it takes only a couple of seconds off your work which, remember, has already been interrupted) and off you go!
For the sake of simplicity, quitting the application is just a matter of double clicking the tray icon.
Customization of the list of readons and output file is done through simple text files.
Results
I have tried the application for a couple of days and, except for getting used to the idea of pressing the shortcut every single time you get interrupted, it’s pretty easy to use and provides useful insights on your work day and efficiency.
I have developed a couple of Powershell scripts to better analyze stored data:
Charting
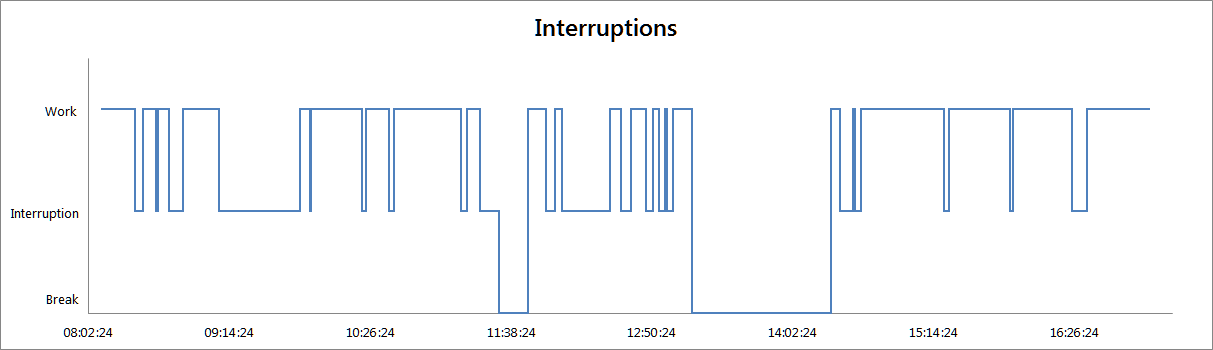
The first script converts the traditional csv output into a different csv file which is better suited to plot interruptions on a chart. Breaks are considered a no-working state (value = 0), interruptions are considered semi-working states (value = 1), the rest of the time is standard work (value = 2).
Here is the script (you can download it here):
Param (
    $InputFile,
    $OutputFile
)

$csv = Import-Csv $InputFile -Header "Start", "End", "Type", "Notes"
$res = @()
$res += "DateTime,Value"
foreach ($l in $csv) {
    $val = 1
    if ($l.Type -eq 'Break') {
        $val = 0
    }

    $res += "$($l.Start),2"
    $res += "$($l.Start),$val"
    $res += "$($l.End),$val"
    $res += "$($l.End),2"
}
$res | Out-File -FilePath $OutputFile
It takes as input the file produced by the application and a path for the processed file.
Here is the chart produced by processing last Friday’s interruptions:
Some numbers
The second script analyzes the data produced by the application, and returns the total number of interruptions and the total interruption time. Breaks are not considered an interruption in this case.
Here is the script (you can download it here):
Param (
    $InputFile
)

$csv = Import-Csv $InputFile -Header "Start", "End", "Type", "Notes"

$total = 0
$sum = [TimeSpan]::FromSeconds(0)

foreach ($l in $csv) {
    if ($l.Type -eq 'Break') {
        continue
    }

    $start = Get-Date $l.Start
    $end = Get-Date $l.End

    $total++
    $sum += ($end - $start)
}

Write-Output "Number of interruptions: $total"
Write-Output "Total interruption time: $($sum.Hours) hours, $($sum.Minutes) minutes, $($sum.Seconds) seconds"
It takes as input the file produced by the application.
Using the same input as the previous script, I found out that over my 7:30 hours of work, I had a total of 21 interruptions, summing up to 2 hours, 30 minutes and 57 seconds of total interruption time. Considering that last Friday was a summer day in which many people were on vacation (so, luckily, fewer interruptions!) and that after each interruption it takes some time to get back to your flow, the result is pretty shocking.
As a test, I tried to modify the script to add 3 minutes after each interruption to account for time spent going back to your flow (please notice that this method is not properly working, as interruptions may be very close to each other), the sum soars up to 3 hours, 33 minutes and 57 seconds. Almost half of my working day was gone without full productivity.
Conclusion
Although tracking your interruptions does not solve the problem,it certainly helps in identifying it. This application is a tool which aids you in the recognition of the problem, setting the first stone of the path towards better productivity.